2017+ Chrysler Pacifica Minivan Forums banner

Hybrid Battery Technical Details

50K views 72 replies 12 participants last post by  Breezy  
I’m curious about the specs of the battery and how much “provisioning” is built into the design of the charging system.

I’ve seen from numerous sources that the battery is spec’d at 16kWh of capacity with 96 cells, but since there are no user settings for adjusting how low it can deplete or how full the system charges the battery, we have to assume that the engineers at Chrysler put sufficient cycle-life provisioning in place so that we get a lot of life out of the battery. That said, I’m still curious how the system works and where the set points really are.

I’ve noticed the system reports 100% and 1% for a lot longer than feasible so I’m convinced there is some kind of User eXperience curve applied to the actual reported capacity value. I’ve seen a few posts where people say that a reported 100% is closer to actual 80% and reported 0% is closer to actual 20%. While I’m convinced there is offset headroom provisioning at the high and low end I’m really curious about what the actual numbers are.

I have a Juice Box Pro 40 which has data logging of the charge current over time so this data is feeding my curiosity. I have a 2018 with about 500 miles on it so I have very little data and brand new batteries.

I have done a few electric only commutes to work now and when I get to 0 percent, the 240v charger puts a reported 13.2 kWh in to get back to “reported 100%”

2.8 out of 16kWh (at reported 0%) would mean there is actually 17.5% left for the hybrid system to manage electric only starts in city driving while keeping the battery from going fully depleted which is known to be hard on lithium Ion batteries.

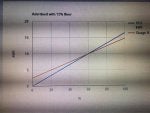
The other bit of data I have is that the system doesn’t go into a slow roll off when it gets close to 100% (reported) charge. When you fully charge a 96 cell, battery managment systems often employ “load balancing” to keep any one of the 96 cells from getting over charged. To charge, the system applies a large DC voltage across all 96 cells in series and if one cell has less total capacity it will fill up before the others and get damaged. To deal with this the cells BMS will bleed off some of the extra which creates heat, also when batteries get near full capacity, charge systems apply a constant voltage and the the charge power starts ramping down at some rolloff dictated by the battery chemistry.

When my 2013 Nissan Leaf charges at 6.5kW to 100%, there is a knee around 92% where it rolls off and takes an hour to get the last ~2kWh of charge.

When the Pacifica is charged to 100% it stays pretty steady at 6.7kW and then for the last 8 minutes it first cuts immediately to half of that charge power, and then has a linear ramp to 0.

So my best guess is that the charge system is not putting the battery into Constant Voltage mode where it has to rely on load balancing, but it is cutting off the charge somewhere well before where a 6.7kW charge would normally roll-off if the battery was in Constant Voltage charge mode.

So I’m really curious what the actual design parameters are. Is the 16kWh battery really a 17.4 kWh where 92% is really 100% and 0% is really 17.5%? Or is it biased more towards the lower end? Or is 0% = 20% and 100% is 80% like I’ve read in some “hand wavy” posts..

Does anyone have the real spec numbers for the battery management system? Does the BMS do load balancing? Is the published capacity de-rated? Is any of this in the service manual?
They don't really give us this info, but there might be enough other info out there to put the picture together. The Battery total capacity quailifies it for rebates and grants and if it was 17.4kW i'm sure it would be advertised.

I would strat looking at the Lithium Ion battery Material first to understand the design requirements and characteristics as you pointed out, since it is dicated by the chemistry. Note, we are on the sencond gen EV Li-S batteries which have a higher power density by size and may have some other chemistry differences.

http://www.mdpi.com/1996-1073/10/12/1937/pdf

https://oxisenergy.com/technology/

In actuality, the battery packs have layers of modules. I dont have the actual names of the internal control modules at the moment so I will refer to them by their general function. The battery pack control module (BCPM this ones a real name) is the interface to the vehicle and oversees the internal cell block manager and cell supervision modules. The cell supervision modules are essentially the basic Lithium Ion charge manager for a small group of cells very similar to the Lithium ion charge design guide IC's i linked. The cell block reads the charge status of the cell managers, voltages and temps and load balances the blocks of cells. And the BPCM recieves the statuses from the load balancing block modules and controls the regen charge acceptance and communicates to the on-board charge module(OBCM another real one) for J1772 charge.

https://www.digikey.ca/en/articles/...n/articles/techzone/2016/sep/a-designer-guide-fast-lithium-ion-battery-charging

You'll notice, or already know, at around 70-80% it switches to a voltage regulated phase to slow charge the remaining battery.

Since the Pacifica does not exhibit this as it completes its recharge process it must end at the beginning of the voltage regulated stage or is a difference 2nd Gen Lithium material.

The goal as you pointed out is to extend battery life. So understanding what ages Lithium ion batterys should be considered.

http://batteryuniversity.com/learn/article/how_to_prolong_lithium_based_batteries

You'll note here that it mentions EV's use 85%-25% depth of charge/discharge but may be different for 2nd Gen lithium-air. It may be closer to 90%-15% since this spread is 75% of 16.6kW which is 12.5kW which is around whats needed to achieve 30mile range at EPA's rated 40kW/100mi.

It mathematically seems reasonable that around 4kW is not utilized from the battery. Note that charge losses are present in tour JuiceBox 13.2kW records so the difference I presume would be the charge loss. For those that are unfamiliar - Some of which is control module activity during charge, coolant pump and heater functions and on board charge module ECM consumption plus AC/DC converter loss and it all adds up. Longer it charges the more deviation will be recorded.

Here is the info I have on our batteries and charge process, heating cooling from Tech Authority.

Thermal efficiency of battery with heating and cooling management info.

https://www.dropbox.com/s/j7r963uigd8up4g/07 - CoolingBatteryDescription and Operation.pdf?dl=0

Battery pack control module functions

https://www.dropbox.com/s/dp975xvb58ez2sl/Bpcm fd.pdf?dl=0

HV Battery Functional description

https://www.dropbox.com/s/hj7qwx8vtptmej1/BCPM Description.pdf?dl=0
 

Attachments

According to the SAE PID for Hybrid Battery Pack Remaining Life, the battery pack is at 90.2% SOC when it shows “100%” on the instrument panel, and 25.9% SOC when the battery hits “0%”.
There we go. Thats great info!

The question I have now is if the battery is actually 16.6kwh then 10% from full is 1.6kwh and 25% from empty is 4.15kW, so together there is 5.81kWh reserved which doesnt add up well.

16.6kWh - 5.81kWh = 10.79kWh which is a little short for EPA's rating and would a count for 26mi range.

(I know some owners report 10-11kWh charges but I'm using the EPA rating values to keep the numbers standardized)

With those reserved block percentages the battery would need to be around 20kWh. 10% from full would be 2kWh, 25% from empty would be 5kWh and together 7kWh is reserved leaving 13kWh remaining for electric range.

EDIT: I know your values are real from the vehicle.. just trying to fit them into the big picture. In case that wasnt clear /forum/images/smilies/wink.gif It seems chrylser hasnt reported the size honestly..

Gotta look at that volt video @StopEject mentioned to see what the difference was again between labeled kWh and advertised.
 
Notably the Volt also takes around 13 kWh for a full charge
So the same charger indicates your pacifica takes the simular 13kWh?

I imagine that charging technology has improved in the past 5 years so it's a bit more efficient on the Pacifica.
I haveny seen anything to suggest it has.. hmmm
 
My OpenEVSE has never recorded a charge of 13kWh. Perhaps it is not accurate, but I am usually at or below below 12.5kWh from 0%.
What could be the reason for the low charges?
I'm missing something in the way the ratings are calculated- maybe someone can find the error.
The ambient temperature is too low- this is true for me, but you are in Texas. I was in Dallas earlier this week and the weather was nice.
The current measured by EVSE is wrong- unlikely. I have two EVs with 30A chargers and both are measured within 1A of 30A.
A software bug limits the charges- unlikely, but we've seen so many other bugs.
FCA was too optimistic with their ratings- things like this happen from time to time. Hyundai was caught over inflating their MPG and Ford had a high end Mustang with fewer horses than advertised.
This is where I am with this - Just doesn't add up.

My obstacles:

Chrysler doesnt rate the energy consumption, EPA does and they dont care to make numbers look better or worse then they actually are.. So the Pacifica isnt actually 31kw/100km effecient like would be needed to make the 30miles on a 10kwh battery and down rated to 40kw/100km for marketing.

The ratings cant be on the full 16kwh battery or they'd be near 50kw/100km at 30miles range.

I dont understand the reason for the various reports of full charge being as low as 10kwh?

With a 25% floor and 10% ceiling battery capacity, the battery would have to size up to 20kwh with 40kW/100mi efficiency.. If it was 15% floor and 10% ceiling however, it would fit.. but the SOC measurements indicate differently.

I'm thinking perhaps the battery is a 20kwh and only 16kwh is available ever and why its rated as such. This would fit the picture, it would also further limit the deep cycling damage. But why not say so?

Saving 25% for the floor SOC ensures plenty power for the vehicle to opperate indefinitely in CS mode..

Seems like we need to confirm and wait for someone to pull a battery and check the labels or find out what A/Hr the cells are.
 
I believe the EPA figures are calculated based on energy at the wall. So for example:

Pacifica
EPA Efficiency: 40 kWh/100mi
EPA Range: 33 miles
kWh per charge: 13.2 kWh

2013 Volt
EPA Efficiency: 35 kWh/100mi
EPA Range: 38 miles
kWh per charge: 13.3 kWh

https://www.fueleconomy.gov/feg/Find.do?action=sbs&id=32655&id=39483
The numbers are standardized.. and besides all we can measure is the engery at the wall.. and this value seems to vary greatly.

The simularity between volt and pachy doesnt seem significant to me..

What are you suggesting?
 
The numbers are standardized.. and besides all we can measure is the engery at the wall.. and this value seems to vary greatly.

The simularity between volt and pachy doesnt seem significant to me..

What are you suggesting?
The energy at the wall does vary, but seems to be close to 13.2 kWh. We have some people measuring less than 13.2 and some measuring more, but 13.2 seems reasonable for a standardized number.

For the Volt, the standard, at the wall is 13.3 kWh.

The 2013 Volt has a usable capacity of 10.5 kWh, so the Pacifica should also have a usable capacity of ~10.5 kWh.
I see what you mean now.

Yeah in post #6 I suggested the battery would need to hold 10.8 kwh to fit within the margins we've determined.. but i'm looking at wall power not the power that makes it to th battery.

Well if EPA rates the energy kw/100mi on wall power than what works.

And the Volt model verifies it. But i cant find any print proof.

Matter of fact, all I find is dyno test routines with meaured/averaged energy consumption - which is the root of my issue.

If the numbers are motor consumption then it does not add up, if they are based on wall consumption then they do.

https://nepis.epa.gov/Exe/ZyPDF.cgi/P100IENB.PDF?Dockey=P100IENB.PDF

https://www.fueleconomy.gov/feg/fe_test_schedules.shtml

https://www.energy.gov/sites/prod/files/2014/03/f10/vss065_lohsebusch_2012_o.pdf
 
Using @Breezy's concept I made an attempt to verify.

I dont have info on the 2013 Volt,.. but WeberAuto did a deep dive on a 2018 volt HV battery and in this video we can clearly see the actual battery capacity is 18.5kWh, (15:50 in)

https://m.youtube.com/watch?v=eWYtq0hxhQg

When we look up the marketing material I find it advertised as an 18.5kW battery and EPA indicates the vehicle has 31kW/100mi efficiency and 53mi electric range by fuel economy.gov

https://www.fueleconomy.gov/feg/Find.do?action=sbs&id=39190

With this known information we can do the math and get 18.5kWh / .31kW per mile and get 59.6mi range. A little more than fueleconomy.gov gives it.

Doing the same with the pacifica indicates that for a range of 33miles, it must use 13.5kWh / .4kW per mile.

10.8kWh would be easy to accept but the 2018 volt Example verifies to me that the numbers dont add up.
 
Interesting thing about using the 2018 volt to infer how the math fits to reality is that it should also be using the same generation of batteries.. And notably that its using almost 17kWh of its 18.5kWh battery.

Rated at 31kW/100mi and getting 53miles range.

In light of this information, I recalled that in the material information provided from Oxis Energy who make Li-S cells that it indicates Li-S has the ability to full discharge without damage.

https://oxisenergy.com/technology/

The materials are proprietary, but are also within the same family of chemistry so they likely share more than they differ.

Any idea who makes the cells for the 2018 Volt and who makes the cells for us?

Edit: Allpar states LG makes the Pacificas and Apparently LG also makes the 2018 Volt battery cells.

Looking into current chemistry things become confusing. They state the current cells are known as NMC622 or NMC811 being made by LG in next two years, but following up on that it seems its already in production..

https://cleantechnica.com/2018/03/04/exciting-developments-nmc-811-lithium-battery-technology/

In the article they say "As NMC has recently gained improved energy density, however, it is now poised to be used more frequently in long-range EVs." but no difference in chemistry is credited.. full discharge for 10years without damage is indicated. I presume the difference is the Sulfur but havent been able to verify sulfur useage.. thinking its a street name for the energy density bump.

This lecture seems promising but i didnt have time at present to enjoy it all.. what I did see was good.. I'll post it anyway.

https://m.youtube.com/watch?v=5WpQh4kZ_MU

Edit: So the lecture indicates the Sulphur IS in the electrolyte known as PES and is the blue lines on almost all these graphs which happen to have the best charactoristics with the exception of the material graphs where they all use PES electrolyte. This information also aligns with the theroy of Li-S battery by MDPI that was in post #2 in a less advanced form.

The MDPI paper indicates the cathode would be made with sulfur and that it would disolve and become apart of the electrolyte such as the PES accomplishes and perhaps it will someday as the tech matures but at present it appears to be only the electrolyte that is responsible for the "increased energy density" mentioned.

http://www.mdpi.com/1996-1073/10/12/1937/pdf

It appears the 25% floor charge is not a requirement any longer and the degradation rate is substainially lower now.
 

Attachments

I plugged up my ELM327 and used Bluetooth to connect my Windows 10 Surface to it. Pacifica was down to 1% battery showing on the dash (ICE ran last 2 miles of trip home). Ran OBD dash.Lite and one of the gauges is this Hybrid/Battery State of Charge (SOC). It was showing 24%. Yesterday I ran it and the dash was showing 36% but and the OBD dash.Lite displayed the SOC at 48%.
Hrmms.. This relationship should be linear meaning we can test some facts.

I plotted the gauge % reading to the battery SOC for several possibilities. The idea being that the point where the guage is equal to the battery SOC will change depending on the way its managed.

IF Its a 16.5kWh battery with 25% floor and 90% ceiling then the point the numbers match (cross point on the graph) is at 70%

This should confirm the scanner data.

IF its a 16.5kWh battery with 15% floor and 90% ceiling then the cross point is at 60%

IF Its a 20kWh battery with 25% floor and 90% ceiling then the cross point is just above 70% - this ones tough because the software I used isnt very clear since the graph has the same ratio as the 16kWh battery (with 0 at 25% and 100 at 90%) that the difference is only caused by the numeric gap between battery sizes.

I used free online graphing software which wouldnt let me save and didnt work on my phone. Sorry for the refresh lines in the pics. This software also wouldnt do 1% increments. I expect the value to end up around 70%, so I'll get better software and redo this for 1% increments so we see if it can be considered conclusive data. It may just be too close to really say.
 

Attachments

I managed to get about 37 miles with indicated 84MPG consumption and 33 miles with 70MPG. It means that the ratings are not right.
Did you reset your economy meter every drive cycle for those numbers?

For me, I see 3 possibilities to why this doesnt add up. Judging from the 2018 Volt the battery should actually be the size chrysler claims it is 16.7kWh, for me (for now) I feel this should be a safe assumption.

So either theres a error on the scantool value (not likely but I have seen it before) or the vehicle is more efficient than reported..

If we rule the above out then perhaps the battery is actually larger than its advertised to be.

Thats why I was looking for the cross point between the guage charge and SOC, this should confirm the scantool reading

Most all EV's are lightweight and only able to carry minimal load. So those EPA ratings would be quite close to real world.. Since the PacHy is able to be loaded up quite a bit I wonder what the test protocals loaded weight is?
 
Yes, I reset the trip meter every time and I know how to control the variables. I kept the heater off. Probably the ratings have some slack to allow the van to stay within specs after minor battery degradation.
I've been playing with this for the last couple days. You may very well be on the money here but I dont feel the guage is accurate enough to make a call either way.

The EPA numbers are based on a repeatable test drive with specific city, highway variables and which from the documentation mention does account for passengers and cargo and useage. I cant find any info on what percentage of passengers or cargo are used since this is a large variable or what the definition of usage is.. with 180A for charging and on-board electronics available it is also another large variable.

Edit: I submitted a freedom of information act request on the loading and accessory useage during the tests.

For single charge measurement purposes I don't see that the mileage guage is accurate enough because It doesn't see instantaneous readings above 100 MPGe. And It doesn't account for regen yet adds to your range. This may squew the short term values whereas long term may work out in the wash.. My biggest issue is that the bulk of cruise occurs at the guages maximum which reduces its resolution IMO. There is potential for a lot of lost info.

But doesnt mean your wrong.

I feel the difference is likely in the cargo loading end of the standard. If they are adding 60% of the 1100lbs max occupant/cargo capacity and and use the heater at 60% with a/c on to set the 40kW/100mi rating.

Most of the vehicles we're using to compare do not have 1100lbs cargo cabability and they're numbers are very close to the ratings.
 
Tesla Model X doesnt add up either.

I downloaded the owners manual and found it has a curb wieght of 5377lbs and a GVWR of 6768lb for a total passenger / cargo limit of 1390lbs.

Battery size is 90kWh and has a minimum recomended 5% before entering low power mode and had a user adjustable maximum. With a maximum reported range of 250mi at 38kW/100mi EPA rating.

Even at 100% battery, at 38kW/100mi it shouldn't get 250mi range.

It seems like large vehicles diverge from the test standard. So the efficiency is not accurate for single occupant light load (kids or no load) and is would be closer 30kW/100mi in these situations.

With this in mind, looking at the Model X's 90kWh battery, then it works
 

Attachments

Hah.. @Breezy i think your right and the Battery is 10.5kw useable capacity and the 13.5kW charges are with charge losses now that I see how the EPA numbers work with the Tesla Model X example.
Yes, here's a thread at Tesla Motors Club where they're talking about the EPA ratings. They also mention that the EPA's kWh/100mi rating is wall-to-wheels, so it accounts for charging losses.

https://teslamotorsclub.com/tmc/threads/help-understanding-wh-mi-epa-vs-displayed.87658/

In the following example, which is based on a Leaf, the EPA says that 16% of energy is lost during charging.

https://www.fueleconomy.gov/feg/atv-ev.shtml
Haha.. I don't buy into all of it yet however. ?

I've read the Tesla forums on this already and I see many users there are solid believers that EPA uses wall to wheel calculations.. but those users do not cite sources or back what they say with any proof. Very frustrating.

So I am reading through government documentation now to "prove" the wall to wheel concept and there really is not much yet stating this tied to EPA or DOT.

My critical issue accepting the wall to wheel explaination is that this number would change depending on the EVSE used. 120v charges wouldnt be the same as 240v/12a charges or 240v/30a charges.. and fast charging would be different again.

My problem is that the math should work and it doesnt. Shouldnt matter if its for small cars or large vehicles. It clearly wotks for little vehicles with the same battery size we use so whats the difference?

So on the Tesla forums many are getting 27-31kW/100mi (270-310Wh/mi) and model X is rated at 36-40kW/100km by EPA and on the dash display showing piwer consumption it indicates the factory rated power (270-310Wh/mi) is for most of the model x range. There is a diconnect between tesla rating and epa rating that with my searchs is not explained either. (Senior members like Bighorn claim they dont get the difference and suggest stick to Tesla ratings. [this attitude is not helpful])

But from all this - I believe that the battery would be actually using only 10.5kW is correct. And our PacHy isnt actually running at 40kW/100mi..
 

Attachments

It has to be wall to wheels. This is the only number that matters to the consumers, they don't care what is going on inside. The test probably specifies charging at the highest supported rate.
Be nice if they indicated it somehow with the standard 40kW/100mi*

*= at highest charge acceptance.

Agreed about finding a source for the wall-to-wheels. I can't see anywhere that it's explicitly stated in any procedural document I've found. It just seems to be an accepted fact on the EV forums I've visited.

It's true that different EVSEs will give different results, but for a standardized test they just need to pick a standard and use it for all ratings. Differences between charging power would fall into the "your mileage may vary" category.
Yeah so far I've dug through SAE J1711 standard and procedures to 40 CFR parts 86-600 and revised 40 CFR parts 1066..

Heres the original document deciding to create a MPGe standard. There are a lot of departments involved. DOE, DOT, EPA, SAE and they consult the industry directly in a Q&A. Oddly they where about to use 81.2kW until the physical constant of 33.7kW brought up by the EVAA, Virginia power and Georgia power..

https://www.gpo.gov/fdsys/pkg/FR-2000-06-12/pdf/00-14446.pdf

It appears the Corperate Average Fuel Economy standard are interested in well(wall)/ to wheel averages but cant find any more info whether they apply correction factors or force it in the rating process.

The math doesn't work? With a 295-mile range at 39 kWh/100mi, a 2018 Model X100D should take approximately 115 kWh to fully charge. But BEV owners don't run their battery all the way down to zero like we do, so measurements they do will require extrapolating based on partial charges.
The Volt has 18.5kWh confirmed battery size and gets advertised 53mi range with 31kW/100mi

Needs to have at least:
16.5kWh / .31kW per mi = 53.4miles
18.5kW / .31kW per mi = 59.7miles

The mileage matches EPA rated range and the difference is porportional available to the missing reserved portion of the battery.

(Keep in mind there is information to indicate that Li-S batteries may handle deeper discharges without damage so 16.5kWh isnt clearly impractical)

At least here the range is possible within the batteries specified capacity and is clearly possible.

2018 Model X has 100kWh battery (85kWh useable) and gets 289mi range with 40kW/100mi

85kWh / .40kW per mi = 210mi?
100kWh / .40kW per mi = 250mi?

15% charge loss indicated on the Tesla forums on 85kWh of a 100kWh battery still doesnt add enough to give it the kWh numbers needed to do 280mi. It would need 112.5kWh to make the EPA values work which would be 25% charge losses.

Maybe thats realistic? But that is the original observation.

They do mention the fuel economy tests are conducted with a load to simulate cargo and people.. Seems like the higher the vehicles load rating the less it adds up but its more likely wall/wheel difference.. gonna keep looking for references.

Edit: Ran some more numbers.

If the 2018 Volt was restricted like our PacHy (25% bottom and 10% at the top for 35%) it still doesnt really seem to work.

35% restriction of 18.5kWh is 12kWh useable and charge losses of 17% only tallys14kWh.. and 25% charge loss would be closer 15kWh for 48mi range not the 16.5kWh needed for 53mi range.

The battery would have to be around 25% restricted for 17% charge loss to fit wall to wheel.

And 27% restricted for 25% charge loss for wall to wheel to work.

EPA indicates 16% loss in charging but obviously isn't firm.

Running more numbers on a select batch of older hybrid and EV vehicles the wall to wheel concept seems to win.

It has to be the situation.
 

Attachments

Aha here we go.

I think I have enough to put this to rest.

Its not surprising that it turns out to be neither explanations. ?

The term "wall to wheel" is made up and made this hard to research. Even on alternative fuel vehicles is still termed "Well to wheel".

So from what I have seen and comprehend, EPA has no direct interest in Well to Wheel data. But has been criticized in the past for being overly optimistic about fuel economy ratings and so has adopted a 5 cycle FE test protocol. In this are new test protocols for aggressive driving and hot and cold climate efficiency and are averaged into the overall resulting rating.

"EPA developed a new approach to estimate the on-road fuel economy based on a five-cycle testing method (EPA 2006). Starting with 2008 MY vehicles, a new EPA method required that vehicles be tested on three additional driving cycles: a high-speed, aggressive driving cycle (US06), a cycle operating at an ambient temperature of 95°F (SC03), and a cycle operating at an ambient temperature of 20°F (cold FTP). These five cycles are now used to construct a weighted average fuel economy for city and highway driving."

Here large heavy vehicles suffer greater penalties than smaller vehicles. No wonder the math doesnt work..

Seperate Well to Pump (WTP) and Well to Wheel (WTW) analysis are made by the government that address The Well To Wheel economics like this report funded by the DOE. And we can see in this report that various conversions and calculation values are applied to the independant EPA FE results based on vehicle types and regions since some electricity generation methods are actually more wasteful than the harvesting and the refining of gasoline.. Well to wheel data seems to vary by source and proximity due to transmission losses.

"However, the fuel-to-mechanical-to-electrical-energy conversion losses associated with electricity generation at the power plant and the losses associated with electricity transmission and distribution to the wall outlet are much higher than the losses associated with fuel production and transportation to the pump. In other words, WTP efficiency is much lower for electricity generation and transmission to the vehicle’s battery compared with fuel production and transmission to the vehicle’s tank"

Wall to wheel or Charge loses are applied with a 85% combined charge efficiency rate and are used for national DOE planning of vehicle charge time and frequency.

Also interesting to note is that there is the ability for the battery reserve capacity to automatically adjust its sizes to retain performance based on SOH? Facinating.

https://www.afdc.energy.gov/pdfs/argonne_phev_evaluation_report.pdf

The FE label also apparently gives different wieght to the various test results.

https://www.energy.gov/sites/prod/files/2014/03/f10/vss065_lohsebusch_2012_o.pdf
 

Attachments

I came across a reference for energy density:

"The Chrysler Pacifica Hybrid pack shown at AABC 2016 was stated to have a volumetric energy density of 113Wh/L and 100Wh/kg which is roughly the same as the second generation Volt pack."

https://www.arb.ca.gov/msprog/acc/mtr/appendix_c.pdf

The pack weighs 368 pounds or 167 kg.

https://newatlas.com/2017-chrysler-pacifica-hybrid-review/51032/

So energy capacity is 167 kg x 0.1 kWh/kg = 16.7 kWh. That corroborates the capacity reported to the Ontario government of 16.7 kWh. This refers to gross, not usable capacity.
These are great document finds! The cool factor is how small our battery is compared to last gen HV batteries. ?